


-
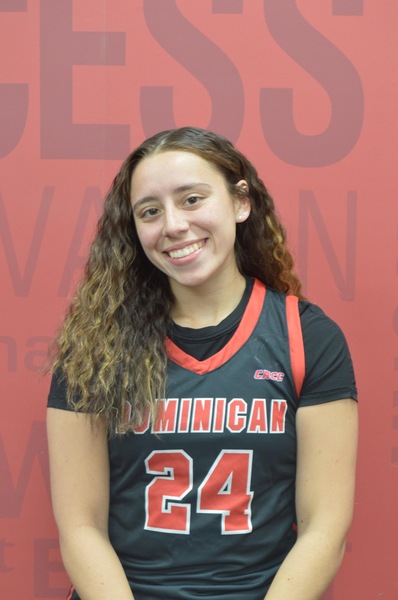
- Height:
- 5-6
-
- Year:
- Gr
-
- Hometown:
- Poughquag, N.Y.
-
- High School:
- John F. Kennedy Catholic
-
- Position:
- G
-
- Major:
- Special Education
-
- gp
- 25
-
- pts/g
- 10.0
-
- fg %
- 35.6
-
- 3pt %
- 12.0
-
- ft %
- 66.1
-
- reb/g
- 4.1
-
- a/g
- 5.6
Bio
One of this year's captains...Scored her 1,000th career point vs Franklin Pierce University on November 19, 2023.
One of this year's captains...Named the CACC Tournament MVP...Named to the CACC All-Tournament Team...Named to the CACC Weekly Honor Roll three times this season.
Earned one CACC Player of the Week honors this season...Named to the CACC Weekly Honor Roll twice this season...Dished out a career high 11 assists vs Chestnut Hill College on February 9, 2022.
Named to the CACC All-Tournament Team.
Prior to Dominican University
- Was a 1,000 point scorer
- Finished high school career with 1,900 points
Recent Games
| Total | Conference | |
|---|---|---|
| Games | 25 | 13 |
| Games started | 24 | 12 |
| Minutes | 874 | 485 |
| Minutes per game | 35.0 | 37.3 |
| FG | 104-292 | 54-149 |
| FG Pct | 35.6 | 36.2 |
| 3PT | 6-50 | 6-31 |
| 3PT Pct | 12.0 | 19.4 |
| FT | 37-56 | 13-22 |
| FT Pct | 66.1 | 59.1 |
| Off rebounds | 18 | 9 |
| Def rebounds | 84 | 47 |
| Total rebounds | 102 | 56 |
| Rebounds per game | 4.1 | 4.3 |
| Personal fouls | 54 | 27 |
| Disqualifications | 1 | 0 |
| Assists | 139 | 78 |
| Turnovers | 60 | 28 |
| Assist to turnover ratio | 2.3 | 2.8 |
| Steals | 66 | 34 |
| Blocks | 8 | 3 |
| Points | 251 | 127 |
| Points per game | 10.0 | 9.8 |
| Points per 40 min | 11.5 | 10.5 |
Game Log - Shooting
| Date | Opponent | Score | gs | min | fg | pct | 3pt | pct | ft | pct | pts |
|---|---|---|---|---|---|---|---|---|---|---|---|
| Nov 10 | vs. D'Youville | L, 74-53 | 1 | 27 | 4-9 | 44.4 | 0-0 | - | 0-2 | 0.0 | 8 |
| Nov 11 | at St. Thomas Aquinas College | L, 79-70 | 1 | 34 | 5-12 | 41.7 | 0-3 | 0.0 | 6-8 | 75.0 | 16 |
| Nov 19 | Franklin Pierce University | L, 71-59 | 1 | 37 | 6-15 | 40.0 | 0-2 | 0.0 | 0-0 | - | 12 |
| Nov 20 | Mansfield University | L, 82-75 | 1 | 14 | 2-4 | 50.0 | 0-0 | - | 1-2 | 50.0 | 5 |
| Nov 25 | vs. Molloy University | W, 70-67 | 1 | 34 | 6-17 | 35.3 | 0-3 | 0.0 | 2-4 | 50.0 | 14 |
| Nov 26 | vs. Queens College | W, 51-47 | 1 | 36 | 3-10 | 30.0 | 0-2 | 0.0 | 2-2 | 100.0 | 8 |
| Nov 29 | University of Bridgeport | L, 67-64 | 1 | 36 | 6-11 | 54.5 | 0-1 | 0.0 | 0-0 | - | 12 |
| Dec 2 | at Post University | L, 88-75 | - | - | - | - | - | - | - | - | - |
| Dec 9 | Pace University | L, 66-60 | 1 | 34 | 4-11 | 36.4 | 0-1 | 0.0 | 0-1 | 0.0 | 8 |
| Dec 16 | Holy Family University | L, 75-57 | 1 | 36 | 7-18 | 38.9 | 0-1 | 0.0 | 4-5 | 80.0 | 18 |
| Dec 30 | Southern Connecticut State University | W, 78-75 | 1 | 35 | 1-10 | 10.0 | 0-1 | 0.0 | 5-6 | 83.3 | 7 |
| Jan 3 | Bloomfield College | W, 72-62 | 1 | 38 | 5-14 | 35.7 | 0-3 | 0.0 | 2-2 | 100.0 | 12 |
| Jan 6 | at Thomas Jefferson Univ. | L, 81-68 | - | - | - | - | - | - | - | - | - |
| Jan 14 | Georgian Court University | W, 81-66 | 1 | 38 | 7-16 | 43.8 | 2-4 | 50.0 | 2-2 | 100.0 | 18 |
| Jan 17 | Felician University | W, 66-54 | 1 | 36 | 3-11 | 27.3 | 1-3 | 33.3 | 2-4 | 50.0 | 9 |
| Jan 27 | Chestnut Hill College | L, 70-60 | 1 | 38 | 5-9 | 55.6 | 0-1 | 0.0 | 0-0 | - | 10 |
| Jan 29 | at Caldwell University | W, 69-64 | 1 | 39 | 2-8 | 25.0 | 1-2 | 50.0 | 0-1 | 0.0 | 5 |
| Jan 31 | at University of Bridgeport | W, 69-56 | 1 | 37 | 4-11 | 36.4 | 0-4 | 0.0 | 1-2 | 50.0 | 9 |
| Feb 3 | Goldey-Beacom College | W, 66-49 | - | 29 | 0-4 | 0.0 | 0-3 | 0.0 | 1-2 | 50.0 | 1 |
| Feb 6 | Post University | L, 64-61 | 1 | 40 | 3-10 | 30.0 | 0-2 | 0.0 | 3-6 | 50.0 | 9 |
| Feb 10 | at Holy Family University | L, 74-57 | 1 | 39 | 2-14 | 14.3 | 0-2 | 0.0 | 1-1 | 100.0 | 5 |
| Feb 12 | at Molloy University | L, 66-60 | 1 | 32 | 1-9 | 11.1 | 0-1 | 0.0 | 2-2 | 100.0 | 4 |
| Feb 14 | Staten Island | W, 75-58 | 1 | 33 | 7-13 | 53.8 | 0-2 | 0.0 | 0-0 | - | 14 |
| Feb 17 | at Wilmington University | W, 58-37 | - | - | - | - | - | - | - | - | - |
| Feb 20 | at Bloomfield College | L, 75-73 | 1 | 40 | 6-11 | 54.5 | 0-0 | - | 1-2 | 50.0 | 13 |
| Feb 24 | Caldwell University | W, 96-71 | 1 | 35 | 8-17 | 47.1 | 2-5 | 40.0 | 0-0 | - | 18 |
| Feb 28 | at Felician University | L, 71-67 | 1 | 40 | 3-13 | 23.1 | 0-1 | 0.0 | 0-0 | - | 6 |
| Mar 5 | at Chestnut Hill College | L, 51-49 | 1 | 37 | 4-15 | 26.7 | 0-3 | 0.0 | 2-2 | 100.0 | 10 |
Game Log - Ball control
| Date | Opponent | Score | gs | min | off | def | reb | ast | to | stl | blk |
|---|---|---|---|---|---|---|---|---|---|---|---|
| Nov 10 | vs. D'Youville | L, 74-53 | 1 | 27 | 1 | 3 | 4 | 2 | 2 | 2 | 0 |
| Nov 11 | at St. Thomas Aquinas College | L, 79-70 | 1 | 34 | 1 | 4 | 5 | 5 | 1 | 0 | 1 |
| Nov 19 | Franklin Pierce University | L, 71-59 | 1 | 37 | 2 | 1 | 3 | 7 | 1 | 3 | 1 |
| Nov 20 | Mansfield University | L, 82-75 | 1 | 14 | 0 | 1 | 1 | 1 | 1 | 3 | 0 |
| Nov 25 | vs. Molloy University | W, 70-67 | 1 | 34 | 1 | 3 | 4 | 3 | 5 | 4 | 0 |
| Nov 26 | vs. Queens College | W, 51-47 | 1 | 36 | 0 | 3 | 3 | 7 | 4 | 3 | 0 |
| Nov 29 | University of Bridgeport | L, 67-64 | 1 | 36 | 1 | 4 | 5 | 7 | 1 | 3 | 0 |
| Dec 2 | at Post University | L, 88-75 | - | - | - | - | - | - | - | - | - |
| Dec 9 | Pace University | L, 66-60 | 1 | 34 | 0 | 6 | 6 | 5 | 2 | 2 | 0 |
| Dec 16 | Holy Family University | L, 75-57 | 1 | 36 | 2 | 2 | 4 | 3 | 2 | 3 | 0 |
| Dec 30 | Southern Connecticut State University | W, 78-75 | 1 | 35 | 2 | 5 | 7 | 13 | 2 | 0 | 0 |
| Jan 3 | Bloomfield College | W, 72-62 | 1 | 38 | 1 | 6 | 7 | 9 | 3 | 4 | 0 |
| Jan 6 | at Thomas Jefferson Univ. | L, 81-68 | - | - | - | - | - | - | - | - | - |
| Jan 14 | Georgian Court University | W, 81-66 | 1 | 38 | 0 | 1 | 1 | 3 | 1 | 4 | 0 |
| Jan 17 | Felician University | W, 66-54 | 1 | 36 | 0 | 6 | 6 | 7 | 1 | 2 | 0 |
| Jan 27 | Chestnut Hill College | L, 70-60 | 1 | 38 | 3 | 6 | 9 | 6 | 2 | 2 | 0 |
| Jan 29 | at Caldwell University | W, 69-64 | 1 | 39 | 0 | 8 | 8 | 5 | 2 | 1 | 2 |
| Jan 31 | at University of Bridgeport | W, 69-56 | 1 | 37 | 1 | 3 | 4 | 10 | 2 | 2 | 0 |
| Feb 3 | Goldey-Beacom College | W, 66-49 | - | 29 | 0 | 4 | 4 | 3 | 2 | 1 | 0 |
| Feb 6 | Post University | L, 64-61 | 1 | 40 | 0 | 1 | 1 | 3 | 1 | 3 | 1 |
| Feb 10 | at Holy Family University | L, 74-57 | 1 | 39 | 1 | 1 | 2 | 7 | 6 | 5 | 0 |
| Feb 12 | at Molloy University | L, 66-60 | 1 | 32 | 0 | 4 | 4 | 5 | 4 | 2 | 2 |
| Feb 14 | Staten Island | W, 75-58 | 1 | 33 | 0 | 2 | 2 | 6 | 3 | 5 | 0 |
| Feb 17 | at Wilmington University | W, 58-37 | - | - | - | - | - | - | - | - | - |
| Feb 20 | at Bloomfield College | L, 75-73 | 1 | 40 | 0 | 3 | 3 | 5 | 4 | 2 | 0 |
| Feb 24 | Caldwell University | W, 96-71 | 1 | 35 | 2 | 2 | 4 | 12 | 1 | 1 | 0 |
| Feb 28 | at Felician University | L, 71-67 | 1 | 40 | 0 | 2 | 2 | 1 | 2 | 4 | 0 |
| Mar 5 | at Chestnut Hill College | L, 51-49 | 1 | 37 | 0 | 3 | 3 | 4 | 5 | 5 | 1 |
Game Log - Ball control extended
| Date | Opponent | Score | gs | pf | dq | a/to |
|---|---|---|---|---|---|---|
| Nov 10 | vs. D'Youville | L, 74-53 | 1 | 4 | 0 | 1.0 |
| Nov 11 | at St. Thomas Aquinas College | L, 79-70 | 1 | 5 | 1 | 5.0 |
| Nov 19 | Franklin Pierce University | L, 71-59 | 1 | 1 | - | 7.0 |
| Nov 20 | Mansfield University | L, 82-75 | 1 | 1 | - | 1.0 |
| Nov 25 | vs. Molloy University | W, 70-67 | 1 | 4 | - | 0.6 |
| Nov 26 | vs. Queens College | W, 51-47 | 1 | 1 | - | 1.8 |
| Nov 29 | University of Bridgeport | L, 67-64 | 1 | 3 | - | 7.0 |
| Dec 2 | at Post University | L, 88-75 | - | - | - | - |
| Dec 9 | Pace University | L, 66-60 | 1 | 3 | - | 2.5 |
| Dec 16 | Holy Family University | L, 75-57 | 1 | 0 | - | 1.5 |
| Dec 30 | Southern Connecticut State University | W, 78-75 | 1 | 2 | - | 6.5 |
| Jan 3 | Bloomfield College | W, 72-62 | 1 | 2 | - | 3.0 |
| Jan 6 | at Thomas Jefferson Univ. | L, 81-68 | - | - | - | - |
| Jan 14 | Georgian Court University | W, 81-66 | 1 | 1 | - | 3.0 |
| Jan 17 | Felician University | W, 66-54 | 1 | 3 | - | 7.0 |
| Jan 27 | Chestnut Hill College | L, 70-60 | 1 | 2 | - | 3.0 |
| Jan 29 | at Caldwell University | W, 69-64 | 1 | 4 | - | 2.5 |
| Jan 31 | at University of Bridgeport | W, 69-56 | 1 | 3 | 0 | 5.0 |
| Feb 3 | Goldey-Beacom College | W, 66-49 | - | 3 | - | 1.5 |
| Feb 6 | Post University | L, 64-61 | 1 | 0 | - | 3.0 |
| Feb 10 | at Holy Family University | L, 74-57 | 1 | 0 | - | 1.2 |
| Feb 12 | at Molloy University | L, 66-60 | 1 | 3 | - | 1.3 |
| Feb 14 | Staten Island | W, 75-58 | 1 | 1 | - | 2.0 |
| Feb 17 | at Wilmington University | W, 58-37 | - | - | - | - |
| Feb 20 | at Bloomfield College | L, 75-73 | 1 | 1 | - | 1.3 |
| Feb 24 | Caldwell University | W, 96-71 | 1 | 3 | - | 12.0 |
| Feb 28 | at Felician University | L, 71-67 | 1 | 2 | - | 0.5 |
| Mar 5 | at Chestnut Hill College | L, 51-49 | 1 | 2 | - | 0.8 |
Career Stats - Shooting per game
Career Stats - Shooting totals
| gp | gs | min | fg | pct | 3pt | pct | ft | pct | pts | |
|---|---|---|---|---|---|---|---|---|---|---|
| 2019-20 | 29 | 21 | 544 | 50-165 | 30.3 | 17-59 | 28.8 | 10-16 | 62.5 | 127 |
| 2020-21 | 14 | 7 | 313 | 44-111 | 39.6 | 12-39 | 30.8 | 15-23 | 65.2 | 115 |
| 2021-22 | 28 | 27 | 800 | 139-336 | 41.4 | 22-90 | 24.4 | 47-62 | 75.8 | 347 |
| 2022-23 | 32 | 32 | 1030 | 145-418 | 34.7 | 20-89 | 22.5 | 65-86 | 75.6 | 375 |
| 2023-24 | 25 | 24 | 874 | 104-292 | 35.6 | 6-50 | 12.0 | 37-56 | 66.1 | 251 |
| Total | 128 | 111 | 3561 | 482-1322 | 36.5 | 77-327 | 23.5 | 174-243 | 71.6 | 1215 |
Career Stats - Shooting per 40 min
| gp | min | min/g | fg/40 | 3pt/40 | pct | ft/40 | pts/40 | |
|---|---|---|---|---|---|---|---|---|
| 2019-20 | 29 | 544 | 18.8 | 3.7-12.1 | 1.2-4.3 | 28.8 | 0.7-1.2 | 9.3 |
| 2020-21 | 14 | 313 | 22.4 | 5.6-14.2 | 1.5-5.0 | 30.8 | 1.9-2.9 | 14.7 |
| 2021-22 | 28 | 800 | 28.6 | 7.0-16.8 | 1.1-4.5 | 24.4 | 2.4-3.1 | 17.4 |
| 2022-23 | 32 | 1030 | 32.2 | 5.6-16.2 | 0.8-3.5 | 22.5 | 2.5-3.3 | 14.6 |
| 2023-24 | 25 | 874 | 35.0 | 4.8-13.4 | 0.3-2.3 | 12.0 | 1.7-2.6 | 11.5 |
| Total | 128 | 3561 | 27.8 | 5.4-14.8 | 0.9-3.7 | 23.5 | 2.0-2.7 | 13.6 |
Career Stats - Ball control per game
Career Stats - Ball control per 40 min
Splits Stats - Shooting per game
| gp | min/g | fg/g | 3pt/g | ft/g | ppg | |
|---|---|---|---|---|---|---|
| Event | ||||||
| Total | 25 | 35.0 | 4.2-11.7 | 0.2-2.0 | 1.5-2.2 | 10.0 |
| Conference | 13 | 37.3 | 4.2-11.5 | 0.5-2.4 | 1.0-1.7 | 9.8 |
| Exhibition | - | - | 0.0-0.0 | 0.0-0.0 | 0.0-0.0 | - |
| Location | ||||||
| Home | 14 | 34.2 | 4.6-11.6 | 0.4-2.1 | 1.4-2.1 | 10.9 |
| Away | 8 | 37.3 | 3.4-11.6 | 0.1-2.0 | 1.6-2.2 | 8.5 |
| Neutral | 3 | 32.3 | 4.3-12.0 | 0.0-1.7 | 1.3-2.7 | 10.0 |
| Result | ||||||
| Wins | 11 | 35.5 | 4.2-11.9 | 0.5-2.9 | 1.5-2.3 | 10.5 |
| Losses | 14 | 34.6 | 4.1-11.5 | 0.0-1.3 | 1.4-2.2 | 9.7 |
| Month | ||||||
| November | 7 | 31.1 | 4.6-11.1 | 0.0-1.6 | 1.6-2.6 | 10.7 |
| December | 3 | 35.0 | 4.0-13.0 | 0.0-1.0 | 3.0-4.0 | 11.0 |
| January | 6 | 37.7 | 4.3-11.5 | 0.7-2.8 | 1.2-1.8 | 10.5 |
| February | 8 | 36.0 | 3.8-11.4 | 0.2-2.0 | 1.0-1.6 | 8.8 |
| March | 1 | 37.0 | 4.0-15.0 | 0.0-3.0 | 2.0-2.0 | 10.0 |
Splits Stats - Shooting totals
| gp | gs | min | fg | pct | 3pt | pct | ft | pct | pts | |
|---|---|---|---|---|---|---|---|---|---|---|
| Event | ||||||||||
| Total | 25 | 24 | 874 | 104-292 | 35.6 | 6-50 | 12.0 | 37-56 | 66.1 | 251 |
| Conference | 13 | 12 | 485 | 54-149 | 36.2 | 6-31 | 19.4 | 13-22 | 59.1 | 127 |
| Exhibition | - | - | - | 0-0 | - | 0-0 | - | 0-0 | - | 0 |
| Location | ||||||||||
| Home | 14 | 13 | 479 | 64-163 | 39.3 | 5-29 | 17.2 | 20-30 | 66.7 | 153 |
| Away | 8 | 8 | 298 | 27-93 | 29.0 | 1-16 | 6.3 | 13-18 | 72.2 | 68 |
| Neutral | 3 | 3 | 97 | 13-36 | 36.1 | 0-5 | 0.0 | 4-8 | 50.0 | 30 |
| Result | ||||||||||
| Wins | 11 | 10 | 390 | 46-131 | 35.1 | 6-32 | 18.8 | 17-25 | 68.0 | 115 |
| Losses | 14 | 14 | 484 | 58-161 | 36.0 | 0-18 | 0.0 | 20-31 | 64.5 | 136 |
| Month | ||||||||||
| November | 7 | 7 | 218 | 32-78 | 41.0 | 0-11 | 0.0 | 11-18 | 61.1 | 75 |
| December | 3 | 3 | 105 | 12-39 | 30.8 | 0-3 | 0.0 | 9-12 | 75.0 | 33 |
| January | 6 | 6 | 226 | 26-69 | 37.7 | 4-17 | 23.5 | 7-11 | 63.6 | 63 |
| February | 8 | 7 | 288 | 30-91 | 33.0 | 2-16 | 12.5 | 8-13 | 61.5 | 70 |
| March | 1 | 1 | 37 | 4-15 | 26.7 | 0-3 | 0.0 | 2-2 | 100.0 | 10 |
Splits Stats - Shooting per 40 min
| gp | min | min/g | fg/40 | 3pt/40 | pct | ft/40 | pts/40 | |
|---|---|---|---|---|---|---|---|---|
| Event | ||||||||
| Total | 25 | 874 | 35.0 | 4.8-13.4 | 0.3-2.3 | 12.0 | 1.7-2.6 | 11.5 |
| Conference | 13 | 485 | 37.3 | 4.5-12.3 | 0.5-2.6 | 19.4 | 1.1-1.8 | 10.5 |
| Exhibition | - | - | - | 0.0-0.0 | 0.0-0.0 | - | 0.0-0.0 | - |
| Location | ||||||||
| Home | 14 | 479 | 34.2 | 5.3-13.6 | 0.4-2.4 | 17.2 | 1.7-2.5 | 12.8 |
| Away | 8 | 298 | 37.3 | 3.6-12.5 | 0.1-2.1 | 6.3 | 1.7-2.4 | 9.1 |
| Neutral | 3 | 97 | 32.3 | 5.4-14.8 | 0.0-2.1 | 0.0 | 1.6-3.3 | 12.4 |
| Result | ||||||||
| Wins | 11 | 390 | 35.5 | 4.7-13.4 | 0.6-3.3 | 18.8 | 1.7-2.6 | 11.8 |
| Losses | 14 | 484 | 34.6 | 4.8-13.3 | 0.0-1.5 | 0.0 | 1.7-2.6 | 11.2 |
| Month | ||||||||
| November | 7 | 218 | 31.1 | 5.9-14.3 | 0.0-2.0 | 0.0 | 2.0-3.3 | 13.8 |
| December | 3 | 105 | 35.0 | 4.6-14.9 | 0.0-1.1 | 0.0 | 3.4-4.6 | 12.6 |
| January | 6 | 226 | 37.7 | 4.6-12.2 | 0.7-3.0 | 23.5 | 1.2-1.9 | 11.2 |
| February | 8 | 288 | 36.0 | 4.2-12.6 | 0.3-2.2 | 12.5 | 1.1-1.8 | 9.7 |
| March | 1 | 37 | 37.0 | 4.3-16.2 | 0.0-3.2 | 0.0 | 2.2-2.2 | 10.8 |
Splits Stats - Ball control per game
| gp | off/g | def/g | reb/g | ast/g | to/g | stl/g | blk/g | |
|---|---|---|---|---|---|---|---|---|
| Event | ||||||||
| Total | 25 | 0.7 | 3.4 | 4.1 | 5.6 | 2.4 | 2.6 | 0.3 |
| Conference | 13 | 0.7 | 3.6 | 4.3 | 6.0 | 2.2 | 2.6 | 0.2 |
| Exhibition | - | - | - | - | - | - | - | - |
| Location | ||||||||
| Home | 14 | 0.9 | 3.4 | 4.3 | 6.1 | 1.6 | 2.6 | 0.1 |
| Away | 8 | 0.4 | 3.5 | 3.9 | 5.3 | 3.3 | 2.6 | 0.8 |
| Neutral | 3 | 0.7 | 3.0 | 3.7 | 4.0 | 3.7 | 3.0 | 0.0 |
| Result | ||||||||
| Wins | 11 | 0.6 | 3.9 | 4.5 | 7.1 | 2.4 | 2.5 | 0.2 |
| Losses | 14 | 0.8 | 2.9 | 3.7 | 4.4 | 2.4 | 2.8 | 0.4 |
| Month | ||||||||
| November | 7 | 0.9 | 2.7 | 3.6 | 4.6 | 2.1 | 2.6 | 0.3 |
| December | 3 | 1.3 | 4.3 | 5.7 | 7.0 | 2.0 | 1.7 | 0.0 |
| January | 6 | 0.8 | 5.0 | 5.8 | 6.7 | 1.8 | 2.5 | 0.3 |
| February | 8 | 0.4 | 2.4 | 2.8 | 5.3 | 2.9 | 2.9 | 0.4 |
| March | 1 | 0.0 | 3.0 | 3.0 | 4.0 | 5.0 | 5.0 | 1.0 |
Splits Stats - Ball control totals
| gp | gs | off | def | reb | ast | to | stl | blk | |
|---|---|---|---|---|---|---|---|---|---|
| Event | |||||||||
| Total | 25 | 24 | 18 | 84 | 102 | 139 | 60 | 66 | 8 |
| Conference | 13 | 12 | 9 | 47 | 56 | 78 | 28 | 34 | 3 |
| Exhibition | - | - | - | - | - | - | - | - | - |
| Location | |||||||||
| Home | 14 | 13 | 13 | 47 | 60 | 85 | 23 | 36 | 2 |
| Away | 8 | 8 | 3 | 28 | 31 | 42 | 26 | 21 | 6 |
| Neutral | 3 | 3 | 2 | 9 | 11 | 12 | 11 | 9 | 0 |
| Result | |||||||||
| Wins | 11 | 10 | 7 | 43 | 50 | 78 | 26 | 27 | 2 |
| Losses | 14 | 14 | 11 | 41 | 52 | 61 | 34 | 39 | 6 |
| Month | |||||||||
| November | 7 | 7 | 6 | 19 | 25 | 32 | 15 | 18 | 2 |
| December | 3 | 3 | 4 | 13 | 17 | 21 | 6 | 5 | 0 |
| January | 6 | 6 | 5 | 30 | 35 | 40 | 11 | 15 | 2 |
| February | 8 | 7 | 3 | 19 | 22 | 42 | 23 | 23 | 3 |
| March | 1 | 1 | 0 | 3 | 3 | 4 | 5 | 5 | 1 |
Splits Stats - Ball control per 40 min
| gp | off/40 | def/40 | reb/40 | ast/40 | to/40 | stl/40 | blk/40 | |
|---|---|---|---|---|---|---|---|---|
| Event | ||||||||
| Total | 25 | 0.8 | 3.8 | 4.7 | 6.4 | 2.7 | 3.0 | 0.4 |
| Conference | 13 | 0.7 | 3.9 | 4.6 | 6.4 | 2.3 | 2.8 | 0.2 |
| Exhibition | - | - | - | - | - | - | - | - |
| Location | ||||||||
| Home | 14 | 1.1 | 3.9 | 5.0 | 7.1 | 1.9 | 3.0 | 0.2 |
| Away | 8 | 0.4 | 3.8 | 4.2 | 5.6 | 3.5 | 2.8 | 0.8 |
| Neutral | 3 | 0.8 | 3.7 | 4.5 | 4.9 | 4.5 | 3.7 | 0.0 |
| Result | ||||||||
| Wins | 11 | 0.7 | 4.4 | 5.1 | 8.0 | 2.7 | 2.8 | 0.2 |
| Losses | 14 | 0.9 | 3.4 | 4.3 | 5.0 | 2.8 | 3.2 | 0.5 |
| Month | ||||||||
| November | 7 | 1.1 | 3.5 | 4.6 | 5.9 | 2.8 | 3.3 | 0.4 |
| December | 3 | 1.5 | 5.0 | 6.5 | 8.0 | 2.3 | 1.9 | 0.0 |
| January | 6 | 0.9 | 5.3 | 6.2 | 7.1 | 1.9 | 2.7 | 0.4 |
| February | 8 | 0.4 | 2.6 | 3.1 | 5.8 | 3.2 | 3.2 | 0.4 |
| March | 1 | 0.0 | 3.2 | 3.2 | 4.3 | 5.4 | 5.4 | 1.1 |
News Mentions
LADY CHARGERS FALL TO GRIFFINS IN CACC QUARTERFINALS
March 5, 2024
DOMINICAN DEFEATS COUGARS IN CACC ACTION
February 24, 2024
LADY CHARGERS EDGED BY BEARS
February 20, 2024
RALLY FALLS SHORT AS DOMINICAN FALTERS IN NON-CONFERENCE ACTION
February 12, 2024
WOMEN'S BASKETBALL FALLS TO HOLY FAMILY UNIVERSITY
February 10, 2024
EAGLES OUTLAST LADY CHARGERS
February 6, 2024
SECOND HALF SURGE LEADS WOMEN'S BASKETBALL OVER PURPLE KNIGHTS
January 31, 2024
LADY CHARGERS UPEND CALDWELL UNIVERSITY
January 29, 2024
GRIFFINS TOP LADY CHARGERS IN 23RD ANNUAL SUE HELLER GAME
January 27, 2024
DOMINICAN DEFEATS GOLDEN FALCONS IN CACC NORTH DIVISION CLASH
January 17, 2024
LADY CHARGERS UPEND LIONS
January 14, 2024
WOMEN'S BASKETBALL EARNS FIRST CACC VICTORY OF THE SEASON
January 3, 2024
LADY CHARGERS OUTLAST OWLS IN SECOND HALF COMEBACK
December 30, 2023
TIGERS TRIP UP LADY CHARGERS
December 16, 2023
SETTERS OUTLAST LADY CHARGERS IN NON-CONFERENCE ACTION
December 9, 2023
LADY CHARGERS FALL IN CACC OPENER TO PURPLE KNIGHTS
November 29, 2023
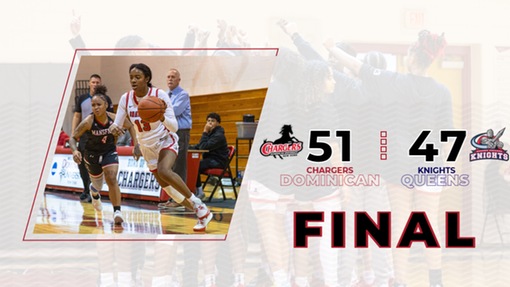
LADY CHARGERS TURN BACK KNIGHTS
November 26, 2023
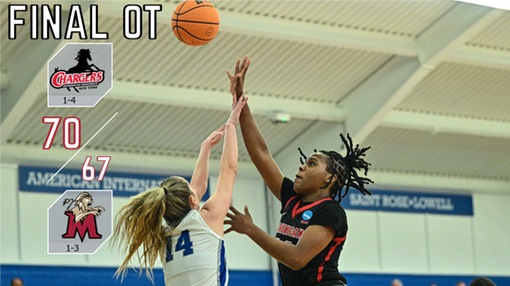
NDUKAUBA SCORES CAREER HIGH IN VICTORY OVER LIONS
November 25, 2023
RAVENS RALLY TO DEFEAT WOMEN'S BASKETBALL
November 19, 2023

WOMEN'S BASKETBALL FALLS TO SPARTANS
November 11, 2023
LADY CHARGERS OPEN SEASON AT 2023 STAC CHALLENGE
November 10, 2023